


Every casino game runs on numbers, but blackjack stands alone as the one where your decisions actually shift the math. Forget luck-based superstitions and rabbit-foot rituals—this guide delivers a blackjack math strategy framework that transforms raw probability into consistent, optimal play. Whether you're memorizing your first chart or fine-tuning index number deviation plays, the goal remains identical: squeeze the house edge below 0.5% and keep it there.
Your instincts aren't calibrated for blackjack math strategy. The human brain overestimates bust risk, fears dealer ten-values, and hesitates on mathematically correct doubles. Each emotional deviation carries a price tag measured in expected value (EV).
|
Mistake Type |
EV Loss per Error |
Frequency (Tourist Average) |
|
Standing 12 vs dealer 2 |
−0.25% |
1 in 18 hands |
|
Not splitting 8s vs 10 |
−0.48% |
1 in 45 hands |
|
Skipping double A-7 vs 3 |
−0.18% |
1 in 62 hands |
|
Taking insurance at TC < +3 |
−4.9% |
Offered every 13 hands |
Survey data from Nevada floor observations reveals alarming patterns: 68% of recreational players mis-split eights against a dealer ten, while 54% never double soft eighteen versus a three. These aren't obscure edge cases—they're common situations where gut feeling bleeds money.
💡The house edge delta between perfect play (0.5%) and average tourist play (2.5%) equals $20 per hour at a $10 average bet. That's your "education tax" until you master the basic strategy matrix.
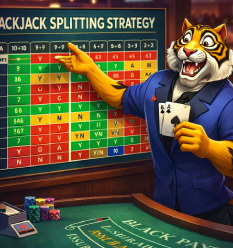
The basic blackjack math strategy matrix isn't a suggestion; it's the mathematically derived optimal response to every possible hand combination. Created through billions of computer simulations, this chart tells you exactly when to hit, stand, double, split, or surrender.
Understanding the four zones:
|
Your Hand |
2 |
3 |
4 |
5 |
6 |
7 |
8 |
9 |
10 |
A |
|
8 |
H |
H |
H |
H |
H |
H |
H |
H |
H |
H |
|
9 |
H |
D |
D |
D |
D |
H |
H |
H |
H |
H |
|
10 |
D |
D |
D |
D |
D |
D |
D |
D |
H |
H |
|
11 |
D |
D |
D |
D |
D |
D |
D |
D |
D |
D |
|
12 |
H |
H |
S |
S |
S |
H |
H |
H |
H |
H |
|
13-16 |
S |
S |
S |
S |
S |
H |
H |
H |
H |
H |
|
17+ |
S |
S |
S |
S |
S |
S |
S |
S |
S |
S |
|
A-7 |
Ds |
Ds |
Ds |
Ds |
Ds |
S |
S |
H |
H |
H |
H=Hit, S=Stand, D=Double, Ds=Double/Stand, Rh=Surrender/Hit
For basic strategy blackjack practice, print this chart and reference it during play. Online platforms like Lucky Tiger allow strategy popups—use them until the decisions become automatic.
Not all blackjack tables are created equal. Rule variations swing the house edge delta by over 1.5% between the best and worst configurations. Smart players shop rules before placing a single chip.
|
Rule Variation |
Edge Change |
Priority |
|
3:2 vs 6:5 blackjack payout |
+1.36% (6:5 is worse) |
🔴 Critical |
|
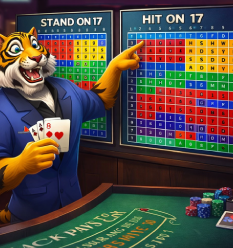
Dealer S17 vs H17 |
+0.22% (S17 is better) |
🟡 Important |
|
Double After Split (DAS) |
−0.14% (DAS is better) |
🟡 Important |
|
Re-Split Aces (RSA) |
−0.10% (RSA is better) |
🟢 Minor |
|
Late Surrender |
−0.08% (surrender is better) |
🟢 Minor |
Correct bet sizing separates winning advantage players from broke ones. Even with perfect strategy, improper bankroll management guarantees eventual ruin through variance.
Three approaches compared:
|
Bankroll (Units) |
0.5% Edge ROR |
1.0% Edge ROR |
1.5% Edge ROR |
|
100 |
40% |
18% |
8% |
|
300 |
13% |
2% |
0.4% |
|
500 |
5% |
0.3% |
0.02% |
|
1000 |
0.7% |
0.01% |
<0.01% |
Your bet spread ramp matters enormously. A 1-8× spread attracts casino heat faster than 1-5× while providing similar hourly EV. The extra aggression rarely justifies the back-off risk.
💡 Session discipline beats session greed. Set a 40% loss limit and 30% win target of your trip stake. Walk away when you hit either boundary.
Card counting isn't illegal, isn't impossibly complex, and doesn't require photographic memory. The Hi-Lo system assigns simple values to every card, letting you track the deck's remaining composition.
The Hi-Lo tag values:
Running count accumulates as cards appear. True count conversion divides running count by remaining decks: TC = RC / decks remaining. This normalization allows comparison across different shoe depths.
The index number deviation system tells you exactly when to abandon basic strategy based on true count. Insurance correlation becomes positive at TC +3 because excess tens make dealer blackjack statistically likely enough to justify the 2:1 payout. Master these five plays first—they capture 80% of all counting-based EV gains.
|
🎲 Situation |
📖 Basic Strategy |
🧠 Index Play |
🔢 TC Threshold |
|
Insurance |
Never take |
Take insurance |
TC ≥ +3 |
|
16 vs 9 |
Hit |
Stand |
TC ≥ +5 |
|
15 vs 10 |
Hit |
Stand |
TC ≥ +4 |
|
9 vs 2 |
Hit |
Double |
TC ≥ +1 |
|
10-10 vs 5 |
Stand |
Split |
TC ≥ +5 |
The index number deviation system tells you exactly when to deviate from basic strategy. Insurance correlation becomes positive at TC +3 because the deck contains excess tens, making dealer blackjack more likely when showing an ace.
Recommended bet spread ramp (8-deck shoe):
Simulation results from 100 million hands show this 1-12 spread generates 0.58% average edge and $23 EV per 100 hands at $25 base bet. That's blackjack math strategy working exactly as designed.
Deck penetration depth determines how much counting advantage you can extract. Deeper penetration means more positive-count betting opportunities and higher true count peaks.
|
Penetration (6D) |
Max Achievable EV |
Practical Assessment |
|
4.5/6 decks (75%) |
+0.55% |
Good for counters |
|
5/6 decks (83%) |
+0.68% |
Excellent conditions |
|
6/6 decks (100%) |
+0.78% |
Theoretical maximum |
|
3/6 decks (50%) |
+0.25% |
Marginal, needs bigger spread |
💡 Refuse any shoe where more than 2 decks remain undealt in a 6-deck game. The standard deviation per 100 hands increases dramatically without corresponding EV improvement.
Beyond index plays, certain hands have optimal decisions that depend on their specific card composition rather than just total value.
Key composition-dependent situations:
These micro-optimizations appear roughly once per 42 hands and add approximately 0.02% to your edge. Free money if you're already tracking card composition for counting purposes.
For players seeking blackjack advanced strategy beyond counting, shuffle tracking offers substantial edge—at substantial difficulty.
The concept: Follow a "slug" of high-card-rich segments through imperfect dealer shuffles. When you identify where that slug lands in the new shoe, increase bets accordingly.
|
Tracking Metric |
Requirement |
Expected Edge |
|
Slug prediction accuracy |
70%+ |
+1.5% to +5% |
|
Training time |
200+ hours |
N/A |
|
Detection risk |
High |
Expect back-offs |
This technique is entirely legal—it's skill, not cheating—but casinos will ask you to leave once identified. The learning curve demands dedicated software training through programs like Casino Verite.
Side bets tempt with big payouts but carry devastating house edges. Most aren't worth touching even for skilled counters.
Side bet breakdown:
Unless you maintain complex side-counts and the table allows significant side-bet maximums, these wagers dilute your overall edge. Focus on main-game blackjack strategy tips instead.
RNG blackjack shuffles every hand, making counting impossible—but basic strategy still delivers 99.5%+ RTP, far better than slots. Live dealer tables use standard 8-deck shoes with 50% penetration, allowing skilled counters to achieve +0.25% to +0.6% edge through proper blackjack strategy online casino techniques. Use RNG games for blackjack practice strategy with zero risk, then graduate to live tables when your index plays become automatic.
|
🎮 Factor |
🖥️ RNG Blackjack |
📹 Live Dealer |
|
Counting viable |
❌ No |
✅ Yes |
|
Hands per hour |
250 |
60 |
|
Achievable edge |
0% (basic only) |
+0.25% to +0.6% |
|
Comp rate |
0.05% |
0.10% |
Casinos tolerate basic strategy players but hunt counters. Survival requires blending in while maintaining edge.
Effective camouflage methods:
Blackjack tournament strategy differs significantly—there you want maximum variance to catch leaders, while cash games demand steady grinding.
The mathematical formula for risk-of-ruin ROR:
R = e^(−2 × edge × bankroll / (bet² × variance))
|
Edge |
Minimum Bankroll (2% ROR) |
Recommended Bankroll (1% ROR) |
|
0.5% |
234 max bets |
468 max bets |
|
1.0% |
117 max bets |
234 max bets |
|
1.5% |
78 max bets |
156 max bets |
Trip stake should equal 40% of total bankroll to survive 90% of worst-case variance swings. This protects against the inevitable losing sessions that occur even with positive expectation.
Mathematical edge doesn't immunize against tilt, fatigue, or addiction. Smart counters implement strict discipline protocols.
Essential safeguards:
Even the best online blackjack strategy fails if you can't walk away. Set your limits before sitting down.
Ready to apply your blackjack math strategy knowledge? Lucky Tiger offers eight-deck games with 70% penetration, $1-$200 limits, and the favorable rules discussed throughout this guide: 3:2 natural payout, dealer stands on soft 17, double after split permitted. Claim your bonus and explore Lucky Tiger Casino.
Platform features for strategy players:


.png)


 slots.png)


.png)


.png)


.png)


.png)